 q4WsCvLajdd4
The planet receives energy mainly from sunlight and loses energy back to space as infrared radiation. The balance between incoming and outgoing energy influences global temperature, atmospheric circulation and the distribution of climate zones.
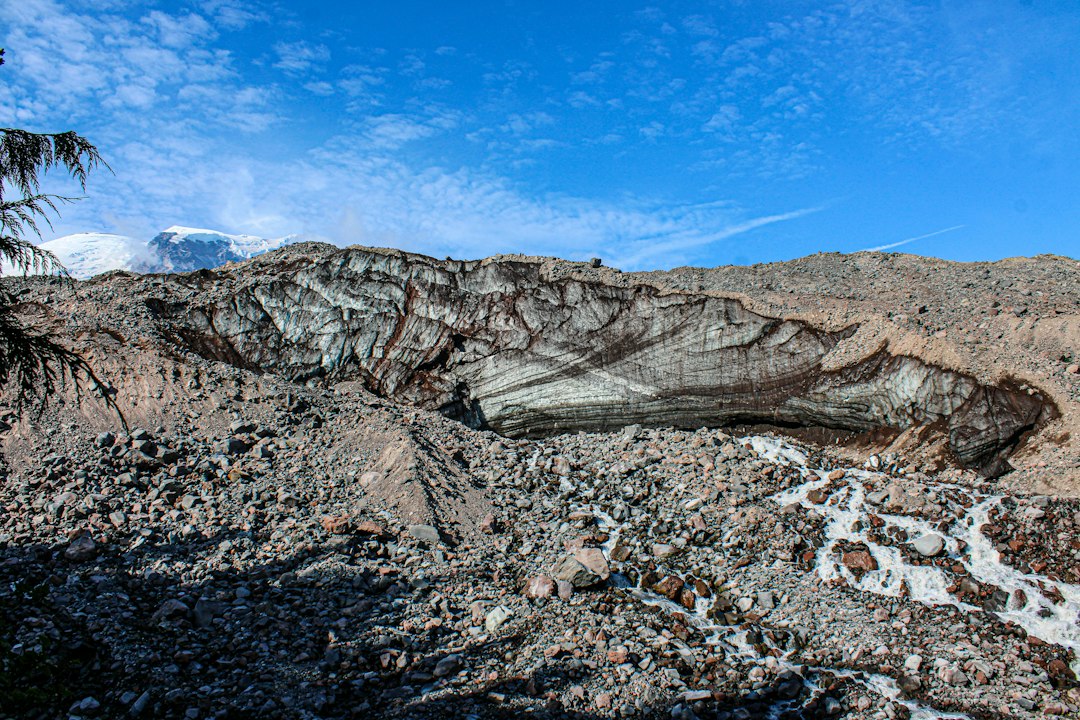
The science behind the subject
Surface reflectivity, greenhouse gases, clouds and ocean heat storage all affect the budget. Ice and bright deserts reflect more sunlight than dark forests or open water, while greenhouse gases absorb and re-emit some outgoing infrared energy.
What the evidence can tell us
Researchers combine satellite observations, ocean measurements, atmospheric data and climate models to estimate energy flows. No single instrument measures the entire system, so independent datasets are compared to identify persistent patterns and uncertainties.
A practical way to observe it
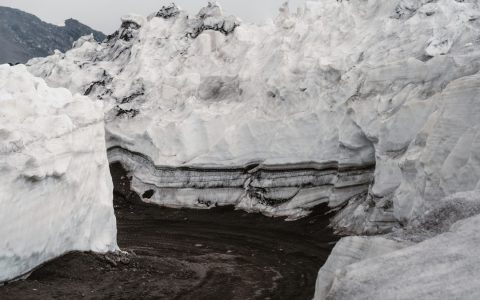
A useful field connection is albedo: compare how dark and light surfaces warm in sunlight, while remembering that a local observation is not a global climate measurement. Surface colour, moisture, vegetation and viewing conditions all matter.
Important limits and misconceptions
Energy imbalance is measured over long periods and across the whole Earth. Short-term weather, seasonal changes and natural variability can temporarily obscure the underlying trend, so claims should be tied to defined datasets and time windows.
Why this matters
Understanding the energy budget links everyday weather to planetary physics. It helps explain why changes in greenhouse gases, clouds, ice cover and ocean circulation can influence climate far beyond the location where they occur.
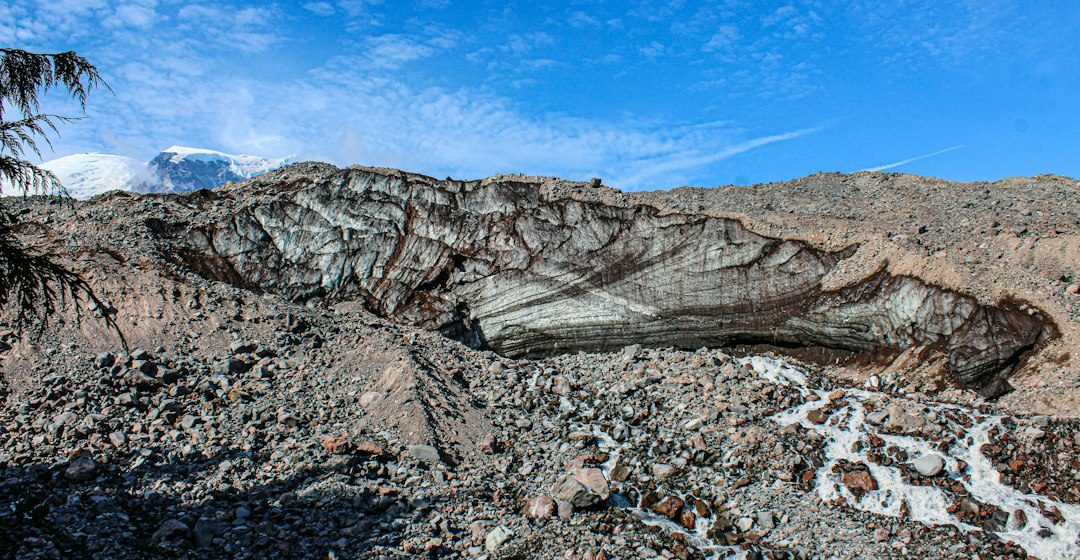
Geological interpretation is strongest when several independent observations point toward the same explanation. A map provides spatial context, a specimen reveals texture and mineral content, and laboratory measurements can test ideas that cannot be settled by appearance alone. Keeping observations separate from interpretations also makes it easier for another reader to review the reasoning.
Scale is especially important. A feature visible in one outcrop may not continue across an entire region, while a process that seems small at one location can become significant when repeated across a basin or across geological time. Geologists therefore compare local evidence with regional mapping, dated samples and records from other environments.
The most useful questions are often simple: what material is present, how is it arranged, what process could produce that arrangement, and what alternative explanation should be tested? This approach avoids treating a familiar shape or colour as proof. It also makes geological knowledge more useful to students, field observers and readers outside the discipline.
For further study, compare the observations described here with geological maps and educational material from national geological surveys or university earth-science departments. Use the original source of any numerical claim, check its date and methods, and note whether a conclusion is an established principle, a current interpretation or an open research question.
Estimated reading time: 4–6 minutes.