 q4WsCvLajdd4
A geological map is more than a coloured version of a normal map. It shows the distribution of rocks and geological structures at or near the Earth’s surface, helping readers understand how a landscape is built and how it has changed. For students, learning to read one is a practical first step toward thinking like a geologist.

Start with the map key
Every geological map includes a legend or key. Colours usually represent different rock units, while patterns and line symbols show boundaries, faults, folds and other features. The same colour scheme is not guaranteed across every map, so never assume that a colour always represents a particular rock type. Read the legend before interpreting the map.
Rock units may be grouped by age, formation or lithology. A formation is a mappable body of rock with recognisable characteristics. Some maps use separate colours for sandstone, limestone, granite and volcanic rocks; others distinguish units primarily by geological age. The legend explains the system used for that particular map.
Understand scale and location
Map scale tells you how map distance relates to distance on the ground. A large-scale map covers a smaller area in greater detail, while a small-scale map covers a broader region with less detail. Scale matters because a boundary that appears precise on a regional map may be generalised from more detailed field mapping.
Use the coordinate grid, north arrow and topographic information to locate features. Contour lines show elevation and can help you recognise ridges, valleys and steep slopes. Comparing the geological map with the topography can reveal why certain rock units form particular landforms.
Read boundaries between rock units
Contacts mark where one mapped unit meets another. Some contacts are depositional, recording a change in sediment or volcanic material. Others are intrusive, where magma entered older rock and later solidified. A fault contact occurs where movement along a fracture has brought different rocks together.
Map lines may be solid, dashed or dotted. A solid line often indicates a boundary that is well located, while dashed or dotted lines may show an approximate or concealed position. Always check the legend because conventions can vary between mapping agencies and map series.
Recognise faults and folds
Faults are fractures along which rocks have moved. On a map, a fault may offset the boundaries of rock units or repeat and omit parts of a sequence. Some faults are marked with special symbols indicating the direction of movement, such as normal, reverse or strike-slip motion.
Folds bend originally layered rocks. Anticlines generally arch upward and synclines bend downward, although erosion and complex deformation can make the pattern less obvious. Strike and dip symbols show the orientation of planar features such as bedding. Strike is the compass direction of a horizontal line on the plane, while dip describes the direction and angle at which the plane slopes downward.
Use the map to form questions
Rather than trying to memorise every symbol, use the map to ask geological questions. Why does one rock unit form a ridge? Does a stream follow a fault or a weak layer? Are the oldest rocks in the centre of a fold or exposed by erosion? Does a younger unit rest on an older one across an unconformity?
These questions connect map patterns with geological processes. A map can suggest an interpretation, but field observations, cross-sections and published explanations are needed to test it.
Build a simple geological cross-section
A cross-section is a vertical slice through the ground, showing how rock units may extend beneath the surface. Begin by choosing a line across the map and transferring the topography onto graph paper or mapping software. Mark where the line crosses geological boundaries, then use strike and dip information to estimate the orientation of layers at depth.
A cross-section is an interpretation rather than a direct photograph of the subsurface. It should be consistent with the map evidence and should clearly show where uncertainty remains. Avoid drawing hidden structures with more precision than the data allow.
Practise with reliable sources
Begin with a simple regional map and its accompanying explanatory notes. Compare the map with satellite imagery, topographic contours and photographs of local outcrops. Keep a small glossary of terms such as formation, contact, strike, dip, fault and unconformity. Repeated practice makes the symbols easier to recognise and the geological story easier to follow.
Further reading: British Geological Survey — Geology of Britain Viewer.
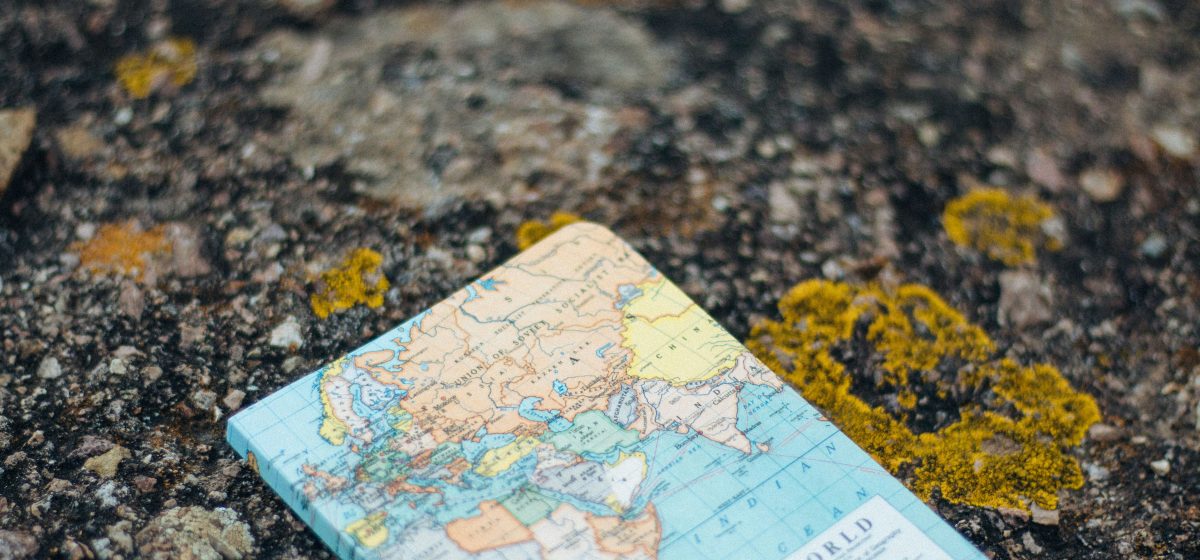
Image: Adolfo Félix / Unsplash.