 q4WsCvLajdd4
A geological map is a guide to the rocks and structures hidden beneath soil, vegetation and buildings. Its colours may look like a patchwork, but each area represents a mapped geological unit, and the lines between them show where those units meet or where structures have been interpreted.
Begin with the map key
The legend is the map’s translation guide. It lists the colours, patterns, abbreviations and symbols used by the geologist. Units are often grouped by rock type, age or formal geological formation. Read the legend before interpreting the map: similar colours on different maps do not necessarily represent the same rocks.
Check the map scale and coordinate system as well. Scale determines how much detail can be shown. A regional map may simplify small outcrops and combine several formations, while a detailed site map can show individual beds and faults.
Understand geological contacts
A contact is a boundary between mapped units. Some contacts are observed directly, while others are inferred beneath soil or recent deposits. A solid line commonly indicates a well-located boundary and a dashed or dotted line may indicate uncertainty, but conventions differ. Always consult the specific map key.
Contacts can represent different geological relationships. A depositional contact forms as one unit accumulates on another. An intrusive contact marks where magma entered older rock. A fault contact occurs where movement has placed different rocks alongside each other. An unconformity represents an interval of erosion or non-deposition.
Read the structural symbols
Strike and dip symbols show the orientation of planar features such as bedding, foliation or joints. Strike is the compass direction of a horizontal line on the plane; dip describes the direction and angle at which the plane slopes downward. These measurements help geologists infer folds, tilted strata and structural trends.
Other symbols may identify faults, fold axes, mineral occurrences, fossils, quarries or measured sections. A map may also distinguish between normal, reverse and strike-slip faults. The symbol explains the interpreted structure, but field evidence is needed to understand its geometry and history.
Use topography as part of the interpretation
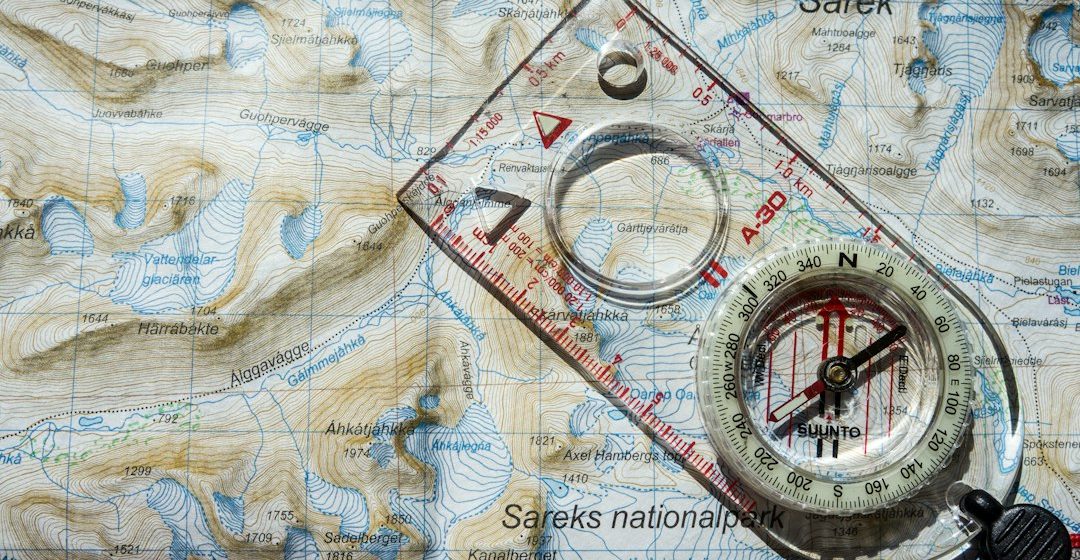
Geological maps are often printed over topographic information such as contour lines, rivers and elevation points. Contours connect locations of equal elevation. Their spacing indicates slope: closely spaced contours generally mark steep terrain, while widely spaced contours indicate gentler slopes.
Topography matters because the same geological layer can appear at different elevations as it crosses hills and valleys. A contact that bends on a map may reflect real folding, changes in topography, or both. Comparing the mapped boundary with contour patterns helps avoid misleading interpretations.
Turn the map into a cross-section
A geological cross-section is a vertical slice through the ground along a chosen line. It shows how units may continue below the surface. To build one, project mapped contacts and structural measurements onto a topographic profile, then use the evidence to interpret the geometry at depth.
A cross-section is an interpretation, not a direct photograph of the subsurface. Several different underground arrangements may fit the same surface data. Good sections make assumptions clear and avoid drawing more detail than the evidence supports.
Common mistakes to avoid
Do not assume that adjacent colours always indicate a simple sequence of deposition. A fault may repeat or omit units, and an intrusion can cut across older rocks. Do not read the legend as a universal colour standard, and do not ignore uncertainty in inferred contacts. Finally, remember that a map records the geology at a particular scale and level of detail.
A map is a scientific argument
Learning to read geological maps means combining the legend, topography, contacts and structural symbols into a coherent explanation. The map is both a record of observations and a reasoned interpretation of Earth’s history. With practice, its coloured patterns become a way to visualise the rocks beneath the landscape.
Image: Map and compass for field geology. Image credit: Hendrik Morkel / Unsplash.